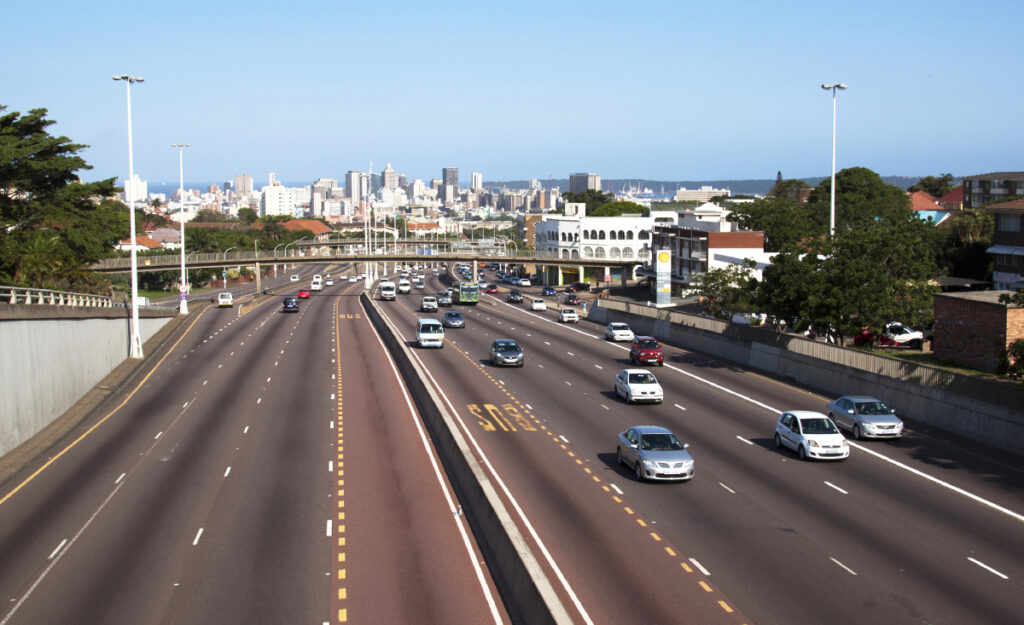
Top 10 smash-and-grab hotspots in South Africa – Per province

A total of 19,409 “theft out of or from motor vehicle” cases were reported in South Africa in the third quarter of the 2024/2025 period, according to new crime data from the South African Police Services.
This means that approximately 210 cars were broken into between October and December 2024.
Theft out of or from a motor vehicle is a category of property-related crime that refers to incidents where items are taken from a car.
This includes smash-and-grab attempts, where a person breaks a window to quickly grab loose items such as a cellphone or handbag, or when a criminal takes tools or packages from the back of a bakkie or panel van.
It also covers the theft of vehicle components, which is a common practice in South Africa as these items can be sold for a quick profit on the black market.
Most often, thieves will try to take components and body parts such as airbags, batteries, tailgates, tyres, wheel rims, headlights, side mirrors, sound equipment, wheel caps, and wiper blades.
As alarming as these statistics are, the silver lining is that theft out of motor vehicle reports dropped by 12.9%, or 2,879 cases, from the same monitored period the year prior.
Smash-and-grab hotspots per province
Gauteng experienced the highest number of cases at 5,286.
The top 10 police stations in Gauteng for smash-and-grabs were as follows:
| Provincial position | RSA position | Station | Thefts reported in Q3 2024/2025 | Count difference |
|---|---|---|---|---|
| 1 | 8 | Pretorial Central | 192 | – 106 |
| 2 | 11 | Sunnyside | 173 | – 29 |
| 3 | 13 | Kempton Park | 169 | – 30 |
| 4 | 14 | JHB Central | 151 | – 48 |
| 5 | 15 | Midrand | 150 | – 36 |
| 6 | 20 | Brooklyn | 124 | – 40 |
| 7 | 21 | Honeydew | 119 | – 48 |
| 8 | 23 | Lyttelton | 117 | – 14 |
| 9 | 28 | Akasia | 112 | + 11 |
| 10 | 30 | Sandton | 110 | – 22 |
The Western Cape had a similar number of reports as Gauteng with 5,149 counts.
The top 10 police stations in the Western Cape for smash-and-grabs were as follows:
| Provincial position | RSA position | Station | Thefts reported in Q3 2024/2025 | Count difference |
|---|---|---|---|---|
| 1 | 1 | Cape Town Central | – 206 | |
| 2 | 4 | Stellenbosh | – 62 | |
| 3 | 5 | Sea Point | – 44 | |
| 4 | 12 | Bellville | – 25 | |
| 5 | 19 | Worcester | – 1 | |
| 6 | 24 | Woodstock | 0 | |
| 7 | 26 | Paarl | – 28 | |
| 8 | 27 | Milnerton | + 17 | |
| 9 | 29 | Table View | – 13 | |
| 10 | 31 | Goodwood | – 16 |
KwaZulu-Natal had the third-highest number of cases at 2,757.
The top 10 police stations in KwaZulu-Natal for smash-and-grabs were as follows:
| Provincial position | RSA position | Station | Thefts reported in Q3 2024/2025 | Count difference |
|---|---|---|---|---|
| 1 | 2 | Durban Central | 295 | – 79 |
| 2 | 33 | Pinetown | 105 | – 61 |
| 3 | 35 | Umbilo | 102 | – 27 |
| 4 | 50 | Richards Bay | 77 | – 61 |
| 5 | 54 | Ladysmith | 73 | + 22 |
| 6 | 57 | Pietermaritzburg | 73 | – 15 |
| 7 | 60 | Point | 71 | – 9 |
| 8 | 62 | Phoenix | 70 | – 5 |
| 9 | 63 | Empangeni | 70 | – 16 |
| 10 | 65 | Mountain Rise | 69 | – 49 |
The Eastern Cape then experienced 1,847 theft out of motor vehicle incidents.
The top 10 police stations in the Eastern Cape for smash-and-grabs were as follows:
| Provincial position | RSA position | Station | Thefts reported in Q3 2024/2025 | Count difference |
|---|---|---|---|---|
| 1 | 3 | Humewood | 203 | – 55 |
| 2 | 20 | East London | 184 | – 67 |
| 3 | 49 | Mount Road | 133 | – 27 |
| 4 | 64 | Cambridge | 116 | – 12 |
| 5 | 81 | Walmer | 78 | + 2 |
| 6 | 89 | Qonce | 50 | – 24 |
| 7 | 125 | Madiera | 43 | – 20 |
| 8 | 146 | Komani | 41 | + 22 |
| 9 | 151 | Kabega Park | 41 | – 3 |
| 10 | 159 | Swartkops | 39 | + 5 |
The rest of the provinces had significantly less cases, with Mpumalanga receiving 1,037 reports.
The top 10 police stations in the Mpumalanga for smash-and-grabs were as follows:
| Provincial position | RSA position | Station | Thefts reported in Q3 2024/2025 | Count difference |
|---|---|---|---|---|
| 1 | 10 | Nelspruit | 180 | + 27 |
| 2 | 18 | Witbank | 125 | 0 |
| 3 | 22 | Middelburg | 117 | + 12 |
| 4 | 83 | Vosman | 57 | + 20 |
| 5 | 117 | Secunda | 43 | + 9 |
| 6 | 181 | Ermelo | 30 | – 10 |
| 7 | 205 | Delmas | 26 | – 16 |
| 8 | 219 | Kwamhlanga | 24 | 0 |
| 9 | 220 | Witrivier | 24 | – 3 |
| 10 | 233 | Carolina | 23 | + 3 |
This was followed by Limpopo with 1,004 reports.
The top 10 police stations in Limpopo for smash-and-grabs were as follows:
| Provincial position | RSA position | Station | Thefts reported in Q3 2024/2025 | Count difference |
|---|---|---|---|---|
| 1 | 3 | Polokwane | 273 | + 16 |
| 2 | 88 | Namakgale | 55 | + 45 |
| 3 | 116 | Seshego | 44 | + 5 |
| 4 | 119 | Mankweng | 43 | + 3 |
| 5 | 135 | Groblersdal | 39 | – 34 |
| 6 | 137 | Westenburg | 38 | – 11 |
| 7 | 163 | Burgersfort | 33 | + 11 |
| 8 | 201 | Musina | 26 | + 2 |
| 9 | 204 | Mokopane | 26 | – 13 |
| 10 | 236 | Lephalale | 23 | – 5 |
North West received a total of 951 reports.
The top 10 police stations in North West for smash-and-grabs were as follows:
| Provincial position | RSA position | Station | Thefts reported in Q3 2024/2025 | Count difference |
|---|---|---|---|---|
| 1 | 16 | Rustenburg | 149 | – 3 |
| 2 | 37 | Klerksdorp | 101 | – 27 |
| 3 | 53 | Potchefstroom | 75 | – 58 |
| 4 | 87 | Mahikeng | 56 | – 41 |
| 5 | 99 | Brits | 51 | – 16 |
| 6 | 154 | Moonooi | 34 | + 19 |
| 7 | 158 | Jouberton | 34 | – 5 |
| 8 | 174 | Mmabatho | 41 | – 15 |
| 9 | 183 | Hartbeespoort | 29 | + 7 |
| 10 | 211 | Tlhabane | 25 | – 2 |
The Free State had the second lowest number of incidents with 920 cases.
The top 10 police stations in the Free State for smash-and-grabs were as follows:
| Provincial position | RSA position | Station | Thefts reported in Q3 2024/2025 | Count difference |
|---|---|---|---|---|
| 1 | 6 | Park Road | 205 | – 31 |
| 2 | 58 | Welkom | 73 | – 17 |
| 3 | 97 | Kagisanong | 51 | – 3 |
| 4 | 143 | Kroonstad | 37 | – 44 |
| 5 | 192 | Phuthaditjhaba | 28 | – 12 |
| 6 | 197 | Bethlehem | 27 | – 1 |
| 7 | 208 | Maokeng | 25 | + 5 |
| 8 | 209 | Sasolburg | 25 | – 1 |
| 9 | 214 | Mangaung | 25 | – 10 |
| 10 | 217 | Bayswater | 24 | + 7 |
The Northern Cape had the lowest number of theft out of motor vehicle attempts with 458 incidents.
The top 10 police stations in the Northern Cape for smash-and-grabs were as follows:
| Provincial position | RSA position | Station | Thefts reported in Q3 2024/2025 | Count difference |
|---|---|---|---|---|
| 1 | 40 | Kimberley | 95 | – 59 |
| 2 | 124 | Upington | 42 | + 13 |
| 3 | 147 | Galeshewe | 36 | – 15 |
| 4 | 168 | De Aar | 32 | + 16 |
| 5 | 235 | Kuruman | 23 | – 2 |
| 6 | 255 | Roodepan | 21 | – 6 |
| 7 | 267 | Kathu | 20 | – 6 |
| 8 | 327 | Springbok | 15 | – 7 |
| 9 | 370 | Sunrise | 12 | + 3 |
| 10 | 374 | Kagisho | 12 | 0 |